Band Structure via VASP
Contents
- Prerequisites
- Overview
- 1. Cell & atom relaxation
- 2. Enforcing symmetries
- 3. Self-consistent electron relaxation
- 4. Calculate electron bands
Prerequisites
Before starting, you will want the following software:
- VASP 5.3 or greater (this requires a license)
pymatgenpython libraries. See here for instructions on installing - I recommend installing with conda.- Access to materialsproject.com
- VESTA (not entirely necessary, but useful visualizations of crystal structures)
Overview
 Here we will compute the band structure of
MoS\(_2\). The main steps are:
- Relax the atomic positions and/or cell
- Check atomic positions/lattice constants to ensure cell symmetries have not been broken
- Perform scf procedure with full \(\mathbf{k}\) mesh
- Calculate bands with selected \(\mathbf{k}\) points
It is useful to set up different directories corresponding to steps 1, 3, and 4.
$ ls
1-relax/  2-scf/  3-bands/
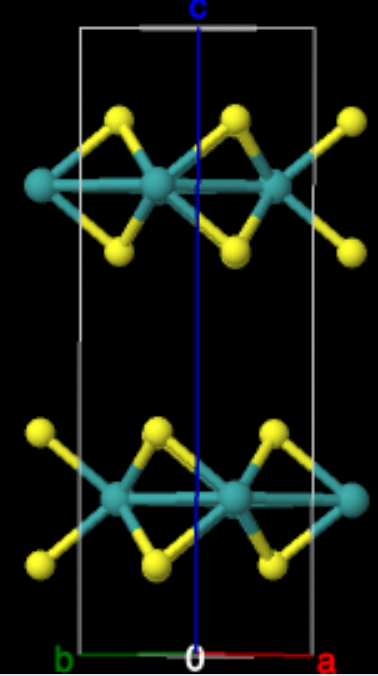
The initial structures for MoS\(_2\) come from the Materials Project (mp-2815).
1. Cell & atom relaxation
Files for this section: github link
In order to get accurate phonon modes, it is necessary to first relax
the atomic positions and/or lattice constants. VASP provides several
different methods for relaxation, provided by specifying the ISIF
tag (see here for
details).
Generally, there are two different cases:
- The desired symmetry of the cell is known, but the atomic positions
and/or lattice constants are not known. In this case, you want to
enforce symmetry of the starting structure in the POSCAR file. You
should use:
IBRION = 2, ISYM = 2. The choice ofISIFalso needs to be specified. To relax atom positions only (lattice constants fixed), chooseISIF = 2. For relaxation of the lattice constants, choose eitherISIF = 3(cell volume can vary) orISIF = 4(cell volume remains fixed). - The symmetry of the initial structure is not known to be
correct. In this case, use
IBRION = 2, ISYM = 0(i.e., turn off symmetry). Usually you wantISIF = 3for this case.
After this calculation, you will want to look at the CONTCAR file
that is output. Depending on the choice of parameters in the INCAR
file, you may notice that the symmetry of the cell has changed. For
example, see the result of the second option
above
here. This
file will need to be modified further (see part 2 below) before
use in DFPT calculations.
2. Enforcing symmetries
Files for this section: github link
After performing the relaxation, it is possible that the resulting
atomic positions and lattice constants in CONTCAR will not be
symmetrized. For example, if using IBRION = 2, ISYM = 0, ISIF = 3,
you will almost certainly not have the exact same lattice constants as
you started with.
For band structure calculations, the wrong symmetry can cause the
choice of \(\mathbf{k}\) path to be wrong if using automated scripts
to generate the path for you. For example, the structure in CONTCAR
could be very close to a hexagonal or tetragonal unit cell, but there
could be just enough difference in the lattice constants for the cell
to be classified as triclinic. This will result in the wrong choice of
path for the band structure calculation.
To fix this problem, you may want to edit the CONTCAR file and
enforce the symmetry you desire. For example, you could see values
like -0.00001248932473 in the x,y, or z components of the lattice
constants. This should most likely be 0, so you can modify and round
to 0.00000000000000. After doing this for the lattice constants and
atomic positions, it isn’t a terrible idea to run another relaxation,
but this time with fixed lattice constants (ISIF =2) and possibly
enforcing symmetry this time (ISYM = 2). This will leave you with a
structure that has the symmetry properties that you most likely want
for phonon calculations.
3. Self-consistent electron relaxation
Files for this section: github link
After relaxing the cell, you can use the final CONTCAR as input to
the scf calculation (i.e., mv 1-relax/CONTCAR 2-scf/POSCAR).

SYSTEM  = MoS2
NCORE   = 8
#KPAR   = 8

ENCUT   = 600
ALGO    = Fast
IBRION  = -1
NSW     = 0
EDIFF   = 1.0e-06
ISYM    = 0
LREAL   = .FALSE.
ISMEAR  = 0
SIGMA   = 0.05
PREC    = Accurate
ADDGRID = .TRUE.

NWRITE  = 1
LCHARG  = .TRUE.
LWAVE   = .FALSE.
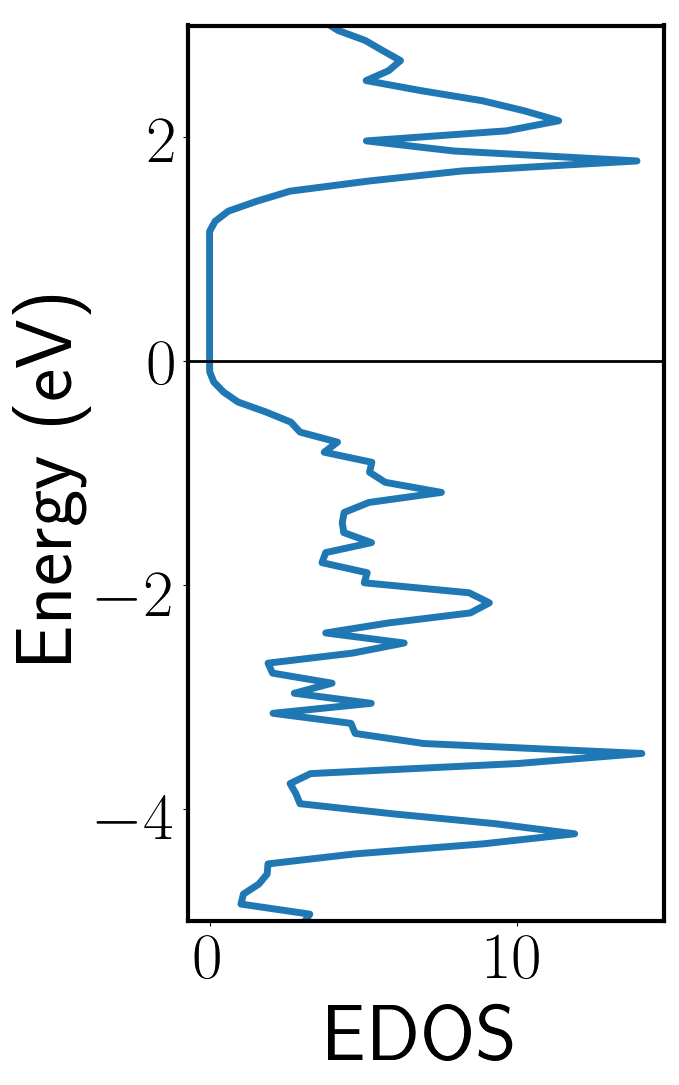
After running this, you can plot the electronic density of states using output from the DOSCAR file. The file vasp-dos.py in the 2-scf/ directory will do this automatically. The density of states is shown at right.
4. Calculate electron bands
Files for this section: github link
After performing the scf calculation, we need to choose an appropriate high symmetry path through the
Brillouin zone and create a new KPOINTS. We then run a non-self-consistent electron calculation using VASP using the CHGCAR file from the 2-scf/folder. Before running VASP, do the following:
$ cp 2-scf/CHGCAR 3-bands
 The easiest way to find the appropriate high symmetry path is by using
the AFLOW website. Go
to
http://aflow.org/aflow_online.html. This
website allows you to copy and paste a POSCAR file from VASP and will
automatically figure out the appropriate \(\mathbf{k}\)-space
path. Paste the POSCAR file to the input window and select ‘Kpath in
the reciprocal space for band structure calculations’, then hit the
Submit button on the top right of the window. This will generate a
file for use in electron band structure calculations. The
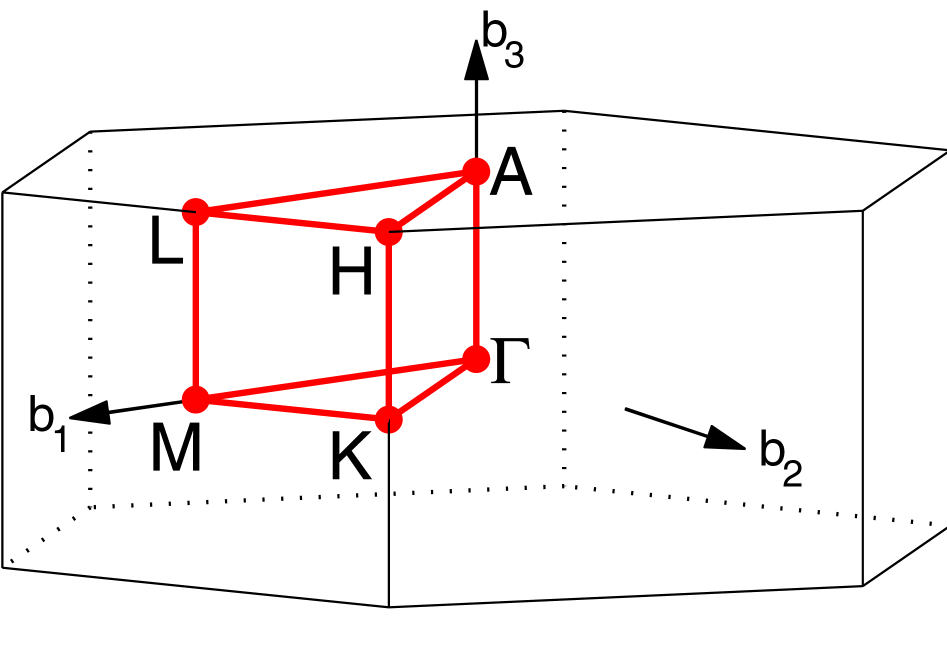
\(\mathbf{k}\)-path for the hexagonal lattice we are using is shown at
right.
The output from AFLOW can now be used to generate band.conf. Our
path is
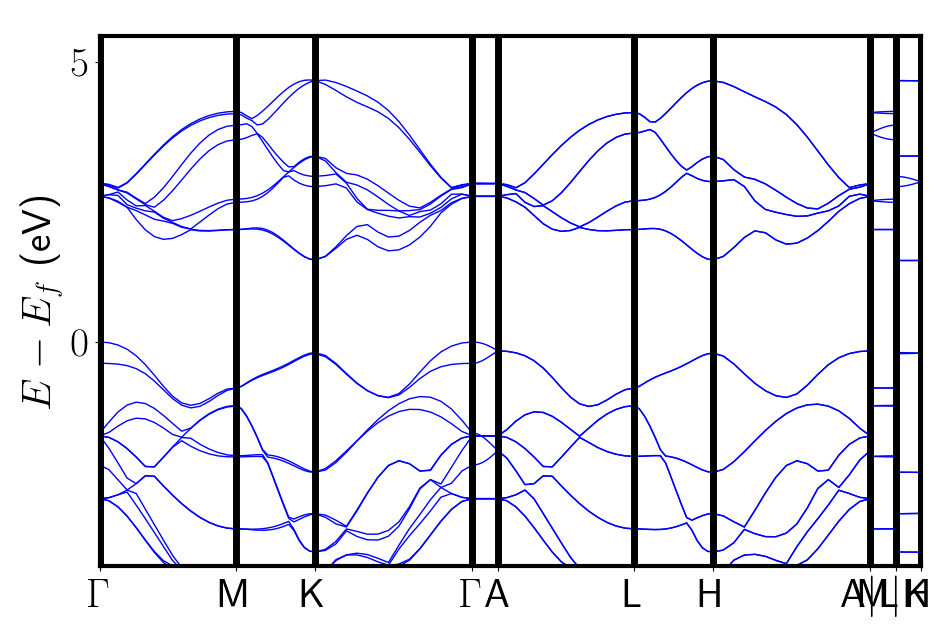
\(\Gamma\)-\(M\)-\(K\)-\(\Gamma\)-\(A\)-\(L\)-\(H\)-\(A\)-\(L\)-\(M\)-\(K\)-\(H\).
The bands are plotted using the electron-bands.py script shown in the 3-bands/ folder. This script uses pymatgen directly to get the bands from the vasprun.xml file.

AFLOW citation: S. Curtarolo, W. Setyawan, G. L. W. Hart, M. Jahnatek, R. V. Chepulskii, R. H. Taylor, S. Wang, J. Xue, K. Yang, O. Levy, M. Mehl, H. T. Stokes, D. O. Demchenko, and D. Morgan, AFLOW: an automatic framework for high-throughput materials discovery, Comp. Mat. Sci. 58, 218-226 (2012). [doi=10.1016/j.commatsci.2012.02.005]
